

What is a Signal? How we score Polymarket trades worth copying
Two traders, the same bet, about $400,000 each. One scores 94 and the other scores 25. The reason is the whole idea behind Signals.
Key Takeaways
- A Signal is one open position held by a proven Polymarket trader, scored from 0 to 100.
- Only wallets in the top 5% of a market's category, or the top 5% overall, with at least 25 past positions get scored.
- The score is mostly the trader's record, plus a bonus when the bet is big for them, and it gets cut when the price has run away from their entry or they hold both sides.
- A high score says the trade still looks worth copying today. It does not predict who wins.
Contents
Here's a puzzle from our Signals page, pulled on September 30, 2026.
Two Polymarket traders hold the same bet: Yes on J.D. Vance winning the 2028 Republican presidential nomination. Each has about $400,000 in it.
- Trader A is ranked #311 on the all-time profit leaderboard, up about $658,000 overall.
- Trader B is ranked #3,179, up about $60,000.
Trader A's position scores 25. Trader B's scores 94.
That isn't a bug. It's the whole point of a Signal score: it rates the trade you can still make, not the trader's past. Trader A bought Vance at an average of 38.1¢. The price is now 50.7¢, so to copy them you'd pay about a third more than they did, and most of their edge is already baked into the price. Trader B paid 55.7¢. At 50.7¢, you'd get in cheaper than they did.
Let's unpack how that works.
What is a Signal?
A Signal is one wallet's open position in one market, held by a trader with a proven record. Each one gets a score from 0 to 100 that says how worth copying the position is right now. Higher is better.
Not every position makes the cut. To show up on the Signals page, a position has to clear a few bars:
- A proven trader. The wallet ranks in the top 5% of one of the market's categories by profit over the past year, or in the top 5% of all traders over the past year.
- A real track record. At least 25 past positions, so one lucky streak doesn't count.
- A real bet. The position cost more than $1,000.
- Not a bot. Wallets with open bets in more than 200 different events at the same time are left out. That's how market makers and farming bots behave, not people with a view.
- Still live. The market is open, and the price hasn't already hit 100¢.
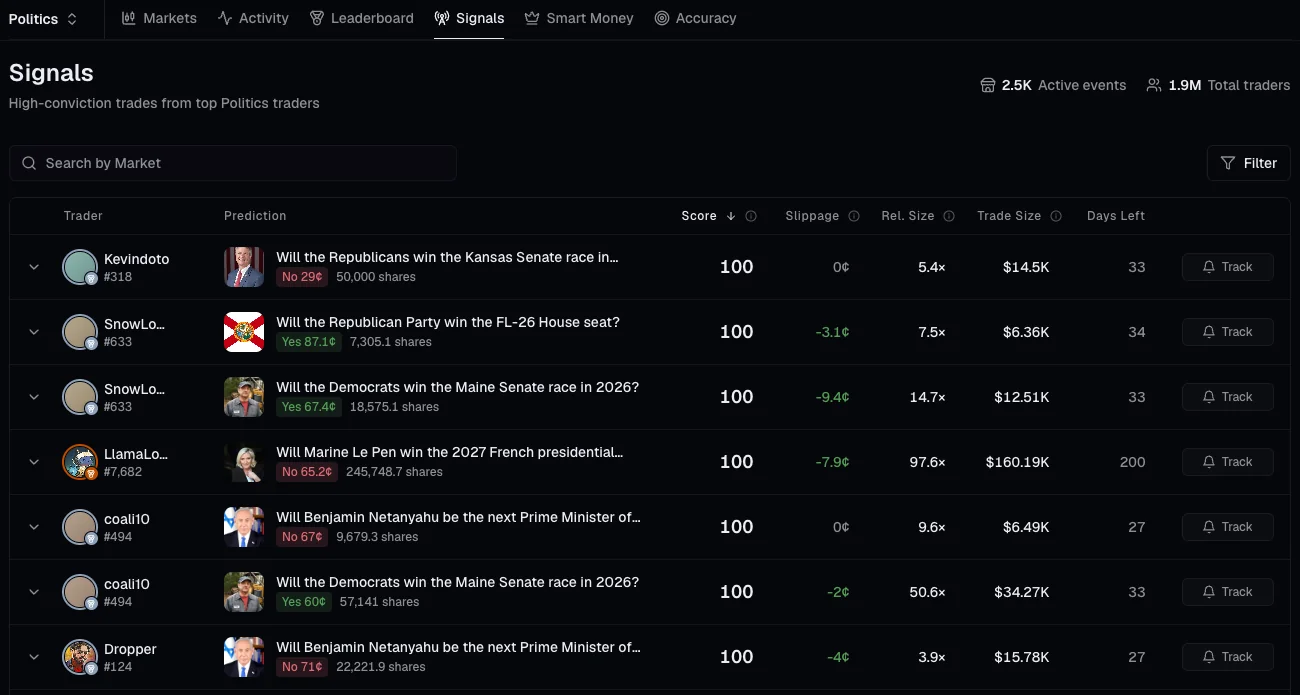
Signals for Politics on October 1, 2026. Negative slippage means the price is now below the trader's entry, so you'd pay less than they did.
What goes into the score
Think of the score as a base, set by who the trader is and how much they're betting, which then gets cut down by two reality checks.
The base: who is betting, and how much
The trader's standing, 90% of the base. How high the wallet ranks among traders in this market's categories over the past year. We use a log scale, so each step up in rarity is worth about the same. On a normal-sized bet, a top 1% trader starts around 72, a top 0.1% trader around 81 and a top 0.01% trader around 90. If they trade several of the market's categories, we blend their standing across them, weighted by how much money they have at work in each.
The size of the bet, for them, 10% of the base. We compare this position with the wallet's usual position size, the median of their recent positions. A bet at their usual size earns nothing extra. The bonus grows from there and maxes out at 3.5 times their usual. So a whale's routine $50,000 bet earns no bonus, while a smaller trader betting five times their norm gets the full 10 points.
Reality check 1: the price you'd pay
This is the one that sank Trader A. When the price has risen since the trader bought, you'd be paying more for the same bet, and less of their edge is left for you. We measure how far the price has moved from their average entry, and scale that by how much room the price had to move, so a jump from 5¢ to 10¢ counts for far more than one from 50¢ to 55¢.
A drop can count too. If the price falls more than 15% below their entry, the market is turning against them, and the score comes down. A smaller dip is fine. It can even be a chance to buy cheaper than they did, which is exactly what happened with Trader B.
This check can cut a score to a quarter of its base, but never lower. Positions whose price has run far away still show up, just down in the 0 to 25 range, so you can see them without mistaking them for opportunities.
Reality check 2: is it really a bet?
If a wallet holds both Yes and No on the same market in similar amounts, it's probably making markets or running an arbitrage, not making a call. The more balanced its book, the lower the score. A perfectly balanced wallet scores zero.
Putting it together
Here's the whole thing in one line:
Score = 100 × price check × one-sidedness × (0.9 × standing + 0.1 × size bonus)
Back to Vance:
- Trader A is an elite trader with a big bet, so their base is close to a perfect 100. But the price has climbed from 38.1¢ to 50.7¢, so the price check sits at its floor of 0.25. Their score: 100 × 0.25 = 25.
- Trader B's base works out to 94. The price, 50.7¢, is below their 55.7¢ entry, but only by about 9%, well inside the 15% band, so the price check leaves it alone. Their score: 94.
Same market, same side, same size. The difference is entirely what it would cost you to join them today.
How to read the score
| Score | What it means |
|---|---|
| 90-100 | Great: a top trader, a real bet, and you can still get close to their price |
| 75-90 | Good |
| 50-75 | Okay |
| 25-50 | Poor |
| 0-25 | Untradeable: the price has run away from the trader's entry |
Using the Signals page
The Signals page lists every scored position, best first. Each row shows the Trader and their rank, the Prediction (market, side, price and shares), the Score, the Slippage (how far the price has moved since the trader's entry, where a negative number means you'd pay less than they did), Rel. Size (this bet compared with their usual), the Trade Size in dollars and the Days Left until the market ends.
A few ways to use it:
- Filter by category to stick to markets you understand.
- Open a market's Signals tab to see every scored position on that market. Here's the 2028 Republican nomination.
- Pair it with a cohort. Every cohort has its own Signals tab, showing only the positions of wallets you've chosen.
- Hit Track on any row to get notified when that trader buys or sells that position again. More on that in our alerts guide.
- Check the trader before you copy anything. The score knows their record, but you might know something it doesn't.
The score stays fresh. The price part is recalculated live every time you load the page, and everything else, from standings and bet sizes to who qualifies, is rebuilt every 15 minutes.
What a Signal is not
A Signal score is not a prediction. It doesn't know who will win the nomination. A 94 means a proven trader has real money on this, the bet is meaningful for them, and you can still get in at a fair price compared with them. Top traders lose bets all the time, and a single trader can run several wallets or hedge somewhere we can't see.
So use Signals as a shortlist for research, not a list of sure things. Datadash shows public on-chain data and how other traders are positioned. It isn't financial advice.
Try it
- Browse today's Signals, filtered to a category you know.
- See the bigger picture of where top wallets lean on each market with Smart Money.
- Get pinged when your favorite traders open a big new position with alerts.
Building something of your own? Signal scores are available through our API and MCP server.